

If you’re one of the few businesses that is still getting data in Universal Analytics, congratulations on your luck! Go buy yourself a lottery ticket. For the rest of us, the transition from the old Universal Google Analytics (UA) to Google Analytics 4 (GA4) has been less than ideal. Trying to understand the new GA4 platform is similar to trying to learn a new language. All of our favorite reports are now in different places or non-existent, and trying to find the same information in GA4 can take 10 times longer if you don’t know where to look. Lucky for you, Revel is here to help you find and recreate your favorite reports from UA into your new GA4 property.
All Traffic >> Traffic Acquisition
The “All Traffic” section in UA was a fan favorite over here. In this section, you could easily see a breakdown of which channels were driving sessions, orders, and revenue. You could also easily filter or add secondary dimensions to your data to drill down into what’s working and what isn’t on your website.

In GA4, the most similar area to “All Traffic” can be found under Reports > Acquisition > Traffic Acquisition. There is also a User Acquisition option, which breaks the report down based on first-user channels vs. session channels. The data changes based on which report you pick, so choose carefully.

In the default version of this report, data will be shown based on Google default channel groupings, with the option to look based on other dimensions like source/medium, campaign, etc. Users can also layer in secondary dimensions like gender, geography, device, and more to further slice and dice the data.
The report includes 10 default metrics, including total users, sessions, and total revenue. Some new metrics are also included like engaged sessions, events per session, and event count. GA4 allows you to customize these reports and save to your account for future reference, including adding filters based on a number of different dimensions.
**Revel tip! Filters are case sensitive when using Regex, so factor that into any filters you are using.

Reports can also be customized to include different dimensions based on what you frequently view. You can even change the default so your favorite dimension shows up first. Want to add some missing metrics like time on site or pages per session? Through report customizations, you can build exactly what you need. Some common metrics have different names but can be found easily if you know what to look for.
Time on site = average session duration
Pages/session = views per session
Ecommerce conversion rate = Session conversion rate (this will only be accurate if purchase is the sole conversion in the account. Otherwise, you’ll have to select purchase to see the CVR)
Google Ads Report >> Custom Exploration
In our opinion, one of the big misses in GA4 is the Google Ads reporting section. In Universal Analytics, you could easily drill down how your Google Ads account was performing, with cost, click and impression metrics marrying into the UA data. The same reporting is possible in GA4, but requires a custom exploration to achieve the same result.
According to Google, Explorations are a collection of advanced techniques that go beyond standard reports. Using the Free Form exploration as a starting point, you can recreate most of the Google Ads report in GA4.
Step 1: Import Dimensions and Metrics
In Exploration reports, you tell GA4 which dimensions and metrics you want to see. In the Variables column, import the following:
Dimensions
Google Ads campaign
Google Ads ad group name
Google Ads keyword text
Google Ads query
Metrics
Google Ads clicks
Google Ads cost
Google Ads cost per click
Total users
Sessions
Bounce rate
Conversions
Session conversion Rate
Purchase revenue

Step 2: Add rows and columns to reports
Now that you’ve imported your desired metrics and dimensions, it’s time to add them to your exploration report. Drag your desired dimension to the “Rows” section in the “Settings” menu. Additionally, add all desired metrics to the “Values” section. This area is also where you would add filters to the data.

Step 3: Review data, rinse and repeat
At this point, your exploration should have all of the data needed for you to start reviewing campaigns. If you’d like to beef up this section, there are many other dimensions and metrics that can be imported into the exploration. Once you’re happy with the data in the table, we recommend duplicating the data to multiple tabs, allowing you to break down by ad group, keyword, and search term. Each duplication becomes another tab in the exploration, making it easy to see all levels of a campaign in one exploration.
A few Revel tips for Explorations
Explorations report on data-driven attribution, whereas Universal Analytics would have reported on last-click attribution.
Explorations are only available to the user who makes them unless they are shared with the rest of the account. These reports also default to the time period set when making them, so make sure to update your dates when revisiting!
Product Performance >> Ecommerce Purchases
Want to know more about how your individual products are performing? In UA, this information could be easily found in the “Product Performance” section under Conversions. GA4 does not provide an identical version of this report but has something very close in the “Ecommerce purchases” section under Monetization.

The report starts with basic information like items viewed, items added to cart, items purchased and item revenue. All of this information will show up if ecommerce tracking is correctly installed on your website for GA4. This section can be further analyzed by hitting the down arrow to change the primary dimension, or the “+” sign to add secondary dimensions like country or default channel grouping. Filters can also be layered in if that’s more your analytical style.
Some metrics in the UA “Product Performance” section like cart-to-detail rate are not available in GA4. However, there are new metrics that can be just as useful in your analysis. GA4 incorporates more data about first time purchasers, like total user and first time purchaser conversion rate. GA4 also has more options to view the checkout journey in the report, like items viewed in list, items checked out, and user conversion rate. Just like the “Traffic Acquisition” report, up to 12 metrics can be added onto this report when customized, so add any metrics that might help!
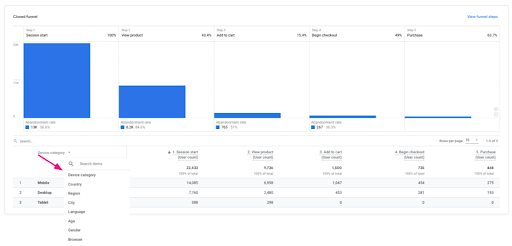
Shopping Behavior >> Purchase Journey
Looking for some pre-made purchase journey reports? The Monetization section also includes “Purchase Journey” and “Checkout Journey” reports, which are nearly identical to their “Shopping Behavior” and “Checkout Behavior” counterparts in UA. Where these reports have a leg up on UA is the pre-existing dimension that you can toggle between while reviewing. The reports default to device category, but a quick drop down allows you to break this data down by country, age, gender, browser, language and more.
There are plenty of reports available in Google Analytics 4, and plenty of areas to make exactly what you’re looking for. Even if you aren't super savvy in the platform yet, these reports should give you the starting point to recreate even more of the sections you were used to in Universal Analytics. Get analyzing!
Photo: ©alubalish